Recent market dynamics have been significantly shaped by the interplay between U.S. government fiscal strategy and Federal Reserve monetary policy, creating a complex environment for the 10-year US Treasury yield. External data indicates that the Treasury’s increased issuance of short-term debt, combined with the Fed’s forward guidance on potential rate adjustments, is becoming a core factor influencing investor sentiment. This coordinated action is viewed by some economists as a form of ‘stealth’ yield curve control. Amidst conflicting signals from inflation reports and employment data, the true impact of these Federal Reserve policy maneuvers on yield curve spreads and the broader economy warrants a deeper investigation.
Latest Market Background and Key Economic Events Impacting Yields
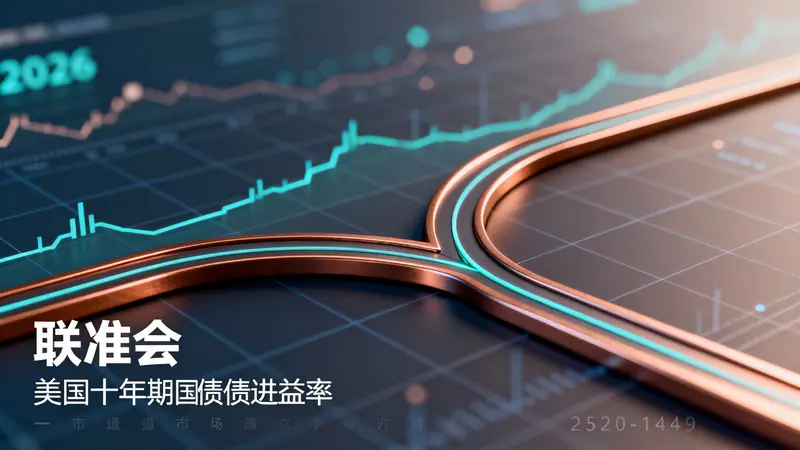
The trajectory of the 10-year US Treasury yield has become a focal point for global investors, acting as a barometer for economic health and a benchmark for pricing assets worldwide. Its recent movements are not random; they are a direct reflection of a potent mix of economic data, policy signals, and market expectations. Understanding these drivers is crucial for navigating the current financial landscape.
💡 Recent Economic Data (Inflation, Employment) Acting as a Catalyst
Economic data remains the primary catalyst for short-term yield volatility. For instance, stronger-than-expected employment reports throughout late 2025 initially suggested a resilient economy, putting upward pressure on yields as markets anticipated a more hawkish Federal Reserve. However, subsequent Consumer Price Index (CPI) readings have shown inflation moderating, albeit stubbornly above the Fed’s 2% target. This tug-of-war in the data forces the market to constantly re-evaluate the Fed’s future actions. A strong labor market suggests the Fed can keep rates higher for longer, while cooling inflation provides a rationale for potential rate cuts in 2026. This uncertainty is a key driver of the daily fluctuations in the bond market.
💡 The Direct Connection Between Recent Policy Statements and Yield Fluctuations
The U.S. Treasury’s debt management strategy has emerged as a significant, yet subtle, influence on the 10-year yield. To fund a growing government deficit of approximately $1.8 trillion for the fiscal year, the Treasury has strategically shifted its issuance towards short-term Treasury bills. Since June 2025, over half of the nearly $930 billion raised came from these short-term instruments. This tactic helps absorb market supply without putting excessive upward pressure on long-term yields. Coinciding with this, Fed officials have maintained a ‘data-dependent’ rhetoric, hinting at rate cuts in 2026. This combination has effectively anchored the 10-year yield within a relatively stable range of 4.0% to 4.5% since mid-2025, a strategy some analysts at GlobalData TS Lombard have dubbed a ‘lite’ version of yield curve control.
Yield Trend Analysis: A Comprehensive Short-Term vs. Mid-Term Outlook
Analyzing the yield’s direction requires a dual focus: understanding the immediate drivers causing daily noise and identifying the larger, structural forces that will shape its path over the next 12-24 months. For those interested in the mechanics of bonds, further reading on Bonds provides foundational knowledge.
💡 Primary Drivers for Short-Term Volatility
In the short term, the 10-year yield is highly sensitive to:
- High-Frequency Data: Weekly jobless claims, Purchasing Managers’ Index (PMI) surveys, and consumer sentiment reports provide real-time snapshots of the economy, often causing knee-jerk reactions in the bond market.
- Fed Speak: Comments from voting members of the FOMC can cause significant repricing as traders parse every word for clues about future policy shifts.
- Treasury Auctions: The demand at government debt auctions, particularly for 10-year and 30-year bonds, serves as a direct gauge of investor appetite for U.S. debt at prevailing rates.
💡 Factors Shaping the Potential Mid-Term Direction
Looking ahead into 2026, the mid-term direction will be dictated by more profound, structural factors. Here’s a comparative look:
| Factor | Potential Upward Pressure on Yields (Bearish for Bonds) | Potential Downward Pressure on Yields (Bullish for Bonds) |
|---|---|---|
| Fiscal Policy | Continued large budget deficits require massive debt issuance, potentially overwhelming demand. | A shift towards fiscal consolidation or increased tax revenue could reduce borrowing needs. |
| Inflation | A re-acceleration of inflation would force the Fed to delay cuts or even hike rates. | Inflation continues its decline towards the 2% target, giving the Fed a clear runway to cut rates. |
| Global Capital Flows | Major foreign buyers (e.g., China, Japan) reduce their holdings of U.S. Treasuries. | Geopolitical instability elsewhere triggers a ‘flight-to-safety’, increasing demand for U.S. debt. |
💡 Cross-Asset Correlation: How Equities and Currencies are Reacting
The 10-year yield is not an isolated metric; its movements send ripples across all asset classes. For equities, particularly high-growth technology stocks, rising yields are a significant headwind. Higher yields increase the discount rate used to value future earnings, making stocks with long-duration cash flows less attractive. Conversely, a falling yield can provide a strong tailwind for the stock market. For the U.S. dollar, higher yields typically increase its appeal to foreign investors seeking better returns, leading to a stronger dollar. This dynamic, in turn, can impact U.S. corporate earnings from abroad and influence global trade balances. For traders looking to act on these correlations, platforms like Ultima Markets MT5 provide the necessary tools for execution.
Decoding Policy, News, and Macroeconomic Factors
Beyond the raw data, the narrative shaped by policymakers and global events plays a crucial role. Market sentiment is often driven as much by perception and anticipation as it is by concrete numbers.
💡 The Federal Reserve’s Stance: Interest Rate Signals and Projections
The Federal Reserve’s primary communication tools—the FOMC statement, press conferences, and the Summary of Economic Projections (including the ‘dot plot’)—are scrutinized intensely. Currently, a disconnect exists between the Fed’s more cautious projections and the market’s more aggressive pricing of rate cuts for 2026. This gap creates potential for volatility. If upcoming data forces the Fed to align with the market’s view, yields could fall sharply. If the Fed holds its ground and the market is forced to capitulate, yields could test the upper end of their recent range.
💡 Global Market Headwinds (Geopolitical Risks, Dollar Strength)
The U.S. bond market does not operate in a vacuum. Geopolitical tensions in other parts of the world can spark a flight to the perceived safety of U.S. Treasury bonds, pushing yields lower. Furthermore, the persistent strength of the U.S. dollar, partly driven by higher relative yields, creates tightening financial conditions globally. This can slow global economic growth, which eventually feeds back into the U.S. economy and could compel the Fed to adopt a more dovish stance, creating a complex feedback loop.
Potential Risks and Opportunities for Investors
For investors, the current environment presents both significant risks and unique opportunities. The key is to remain vigilant and understand the catalysts that could shift the market regime. The security of investment capital is paramount, a principle detailed in resources concerning fund safety.
💡 Key Risk Factors to Watch
- Sticky Inflation: Any sign that inflation is becoming entrenched would be the biggest risk, as it would undermine the case for rate cuts and could push the 10-year yield significantly higher.
- Unexpected Policy Shifts: A sudden change in communication from the Fed or a disruptive shift in the Treasury’s auction schedule could catch markets off guard.
- Fiscal Dominance Concerns: If markets begin to fear that the Fed will be forced to keep rates artificially low to help the government finance its debt, it could lead to a loss of confidence and a spike in long-term yields.
💡 Potential Catalysts for a Market Rebound or Yield Stabilization
Conversely, several factors could lead to a more favorable environment. A definitive signal from the Fed that rate cuts are imminent would be a powerful catalyst for a bond market rally (and lower yields). Continued moderation in economic growth and inflation would reinforce this narrative. Stabilization can also be achieved if the Fed and Treasury successfully manage market expectations, leading to a period of lower volatility where the 10-year yield trades within a predictable range, offering opportunities for both bondholders and equity investors.
FAQ
1. What is the relationship between the 10-year US Treasury yield and bond prices?
The relationship is inverse. When the price of a bond goes up, its yield goes down, and vice versa. Think of it like a seesaw. If you buy a bond for $100 that pays a $5 coupon, its yield is 5%. If market demand pushes the price of that bond up to $110, the new buyer still only gets the $5 coupon, so their effective yield is now lower (about 4.5%). Conversely, if the price drops to $90, the yield for the new buyer becomes higher (about 5.5%).
2. How does the Federal Funds Rate affect the US 10-year government bond yield?
The Federal Funds Rate is the overnight interest rate at which banks lend to each other. It directly controls very short-term interest rates. Its influence on the 10-year yield is indirect but powerful. The 10-year yield reflects the market’s expectation of what the average short-term rate will be over the next decade, plus a term premium. So, when the Fed signals future rate cuts, the 10-year yield typically falls immediately, as the market prices in a lower average short-term rate over its lifespan.
3. What is the forecast for the 10-year US Treasury yield in the next 6-12 months?
Forecasting is inherently difficult, but a consensus is forming around a few key scenarios. Most analysts project the 10-year yield will trade within a range of 3.8% to 4.5% over the next year. The path it takes will depend almost entirely on the timing and pace of Federal Reserve rate cuts. A scenario with moderating growth and falling inflation could see the yield drift towards the lower end of that range by mid-2026. However, if inflation proves sticky or the economy re-accelerates, the yield could remain elevated near the 4.5% level or even higher.
Conclusion
The 10-year US Treasury yield is currently at a critical juncture, caught between the Treasury’s immense financing requirements and the Federal Reserve’s delicate task of guiding inflation back to its target without derailing the economy. The apparent ‘stealth’ coordination between these two bodies has managed to contain yields for now, but the underlying tensions remain. For investors, success in 2026 will hinge on closely monitoring inflation and employment data, deciphering the Fed’s evolving narrative, and understanding how global capital flows are reacting to the complex U.S. economic picture. While risks of volatility are high, the potential for opportunities in both bond and equity markets is equally significant for the prepared investor.