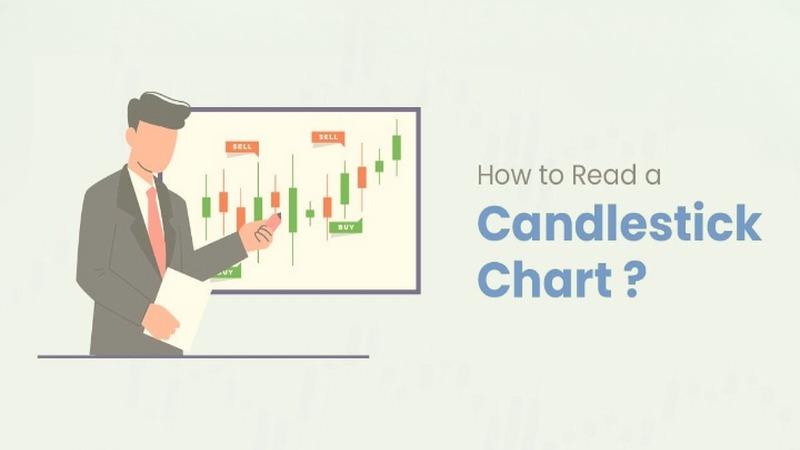
For anyone starting out in trading, candlestick charts are often the very first tool to master. They provide a clear picture of market dynamics, whether in forex, stocks, or crypto. Compared with other chart forms, candlestick charts are straightforward, visual, and widely adopted.
This guide walks you through the essentials of candlestick chart reading, including structure, interpretation, and strategy building, with examples based on Ultima Markets’ platform to help you get hands-on practice.

What is a Candlestick Chart?
The candlestick chart, or K-line, originated in 18th-century Japan as a way to track rice prices, later introduced globally by Steve Nison. Now it’s a cornerstone of technical analysis across multiple asset classes.
Each candlestick reflects price activity within a selected time frame—daily, hourly, or even minutes—capturing four data points: open, high, low, and close.

A candlestick consists of the body and the shadow:
- Body: the range between open and close; length signals buying or selling strength.
- Shadows (wicks): mark the highest and lowest prices reached.
- Color: commonly, red signals bullish momentum and green represents bearish momentum (as used in Taiwan markets).
Grasping these basics is the first step to interpreting any candlestick chart.
How to Read a Candlestick Chart? Step-by-Step Guide
When learning candlestick reading, focus on these four aspects:

Observe the body length and color:
- A long red candle = strong upward force.
- A long green candle = downward pressure is dominant.
- Small bodies (like doji) = indecision or possible reversal.
Interpretation of upper and lower shadows:
- A long lower shadow shows strong buying support.
- A long upper shadow with closing near the bottom signals heavy selling.
Combine volume with candlestick analysis:
- A surge in trading volume paired with a breakout candlestick often validates the strength of the trend.
Identify single and multiple candlestick patterns:
- Single candles: doji, hammer, morning star, etc.
- Multi-candle formations: three white soldiers, three methods.
Using MT4/MT5 on Ultima Markets, you can link candlestick shapes with volume and indicators for more reliable insights.
Typical Candlestick Patterns to Know
Understanding common patterns helps traders anticipate reversals or continuations.

Hammer and Doji
- Hammer/Hanging Man: long lower shadow, suggesting possible rebound or exhaustion.
- Doji: open and close nearly equal, highlighting indecision or trend reversal.
Engulfing Pattern
- Bullish engulfing: a large bullish candle wraps the prior bearish one, signaling potential upside reversal.
- Bearish engulfing: the reverse, hinting at downward momentum.
Three White Soldiers and Three Methods Pattern
- Three white soldiers: strong bullish continuation.
- Three methods: consolidation within a trend before it resumes.
These signals work best when evaluated with trend context and volume. Ultima Markets’ Trading Central can auto-detect such setups for traders.
Stocks vs Forex: Application Differences
Though candlesticks are universal, context matters.
Forex Market Characteristics
The forex market operates 24 hours a day, so price gaps are less common. Timeframes like M15, H1, H4, and D1 are frequently used by traders, with a greater emphasis on trend continuity.
Stock Market Characteristics
Daily sessions create price gaps; market is shaped by earnings, institutional orders, and liquidity. Analysis often combines candlesticks with fundamentals.
How to Read Candlestick Charts Across Different Timeframes?
- Daily candlesticks are suitable for short- to medium-term trading;
- Weekly and monthly candlesticks are better for identifying long-term trends.
UM supports MT4/MT5 and the UM App, offering round-the-clock trading with customizable chart timeframes. It is an ideal environment for practicing and comparing daily versus weekly candlestick interpretations.
Combining Candlestick Charts with Support and Resistance Levels to Build a Personalized Strategy
Candlestick charts alone are not sufficient to build a complete trading plan. They must be paired with support and resistance analysis.
Support levels are price areas where a downtrend may pause or reverse, while resistance levels are where upward price movement may stall. When a candlestick breaks through one of these key zones, it can trigger a strong trend continuation.

How to Draw Support and Resistance Lines on a Candlestick Chart
Mastering the drawing of support and resistance lines on candlestick charts allows traders to analyze entry and exit points using candlesticks and horizontal lines together:
- Identify range highs and lows: connect previous highs to form resistance lines and lows to form support levels.
- Observe breakout signals:
- A price breaking above resistance, accompanied by a long bullish candle and rising volume, is a suitable entry signal.
- A drop below support with a long bearish candle and increased volume may signal a need to hedge or short.
- Use RSI and MACD as supplementary indicators to enhance success rates.
By combining these tools, seemingly random candlestick signals can be transformed into actionable trading strategies. Ultima Markets’ charting tools support one-click line drawing and price alerts, ideal for traders requiring real-time responsiveness.
Improving Accuracy in Reading Candlestick Charts
While candlesticks are visual, adding platform tools boosts reliability. Ultima Markets’ demo account provides simulated trading with alerts, expert advisors, and pattern detection—ideal for practice without risk.
Why Choose Ultima Markets?
Choosing Ultima Markets ensures safer and more efficient trading. Whether you’re a beginner or an advanced trader, you can access professional tools, demo accounts, and 24/7 Chinese-speaking support for a comprehensive trading experience.
- Demo account: get $100,000 in virtual funds to practice candlestick pattern analysis and support/resistance drawing without any risk.
- 24-hour access to MT4/MT5, WebTrader, and UM App: switch between daily, weekly, and monthly charts to clearly compare timeframes.
- Built-in charting tools: automatically detect common candlestick patterns and integrate volume, RSI, and MACD for more precise trading.
- Real trading with low entry threshold: easily transition from demo to trading account with a seamless process.
With these features, UM is the go-to platform for beginners entering technical analysis.
Conclusion
Candlestick charts remain one of the most effective ways to read market sentiment in 2025. For anyone starting, the best way forward is to test strategies in a demo environment and gradually move to live trading. Ultima Markets provides the platform and resources you need to learn, practice, and transition smoothly.

