Financial statements can be intimidating for aspiring investors and business owners, and the balance sheet, with its terminology, often seems complex. However, it’s one of the most important tools for understanding a company’s financial position. This guide simplifies the balance sheet, helping you understand, read, and analyse it confidently to make better financial decisions.
What is a Balance Sheet? A Snapshot of Financial Health
A balance sheet, along with the income statement and cash flow statement, is one of three core financial statements. It summarizes a company’s financial position by showing what it owns (assets), owes (liabilities), and its owners’ investment (equity). Think of it as a snapshot of the company’s financial state at a specific point in time.
The Core Purpose: Understanding a Company’s Position at a Single Point in Time
The balance sheet’s key feature is its static nature, providing a snapshot at a specific point in time. For example, a company’s annual report shows a balance sheet ‘as of 31 December 2024’. This snapshot is crucial as it sets the baseline for analyzing a company’s resources and obligations.
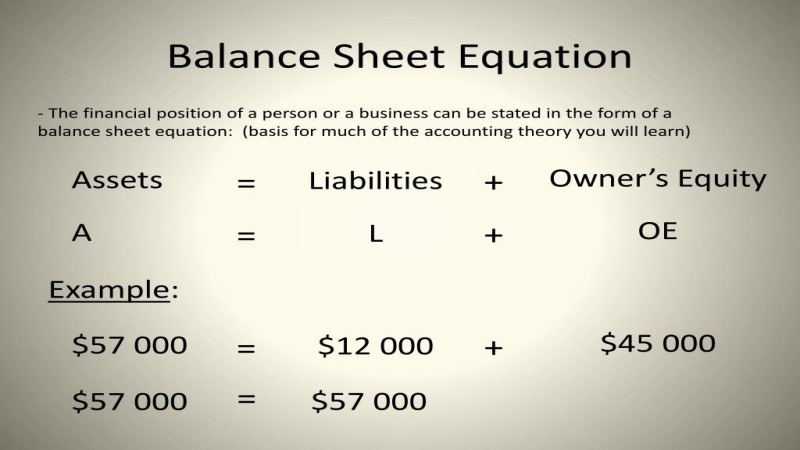
The Fundamental Accounting Equation: The Heart of the Balance Sheet
The balance sheet is based on the fundamental accounting equation:
Assets = Liabilities + Shareholder’s Equity
This equation must always balance. It shows that assets are financed either through borrowed money (liabilities) or owners’ investment (equity). If the two sides don’t match, it signals an accounting error.
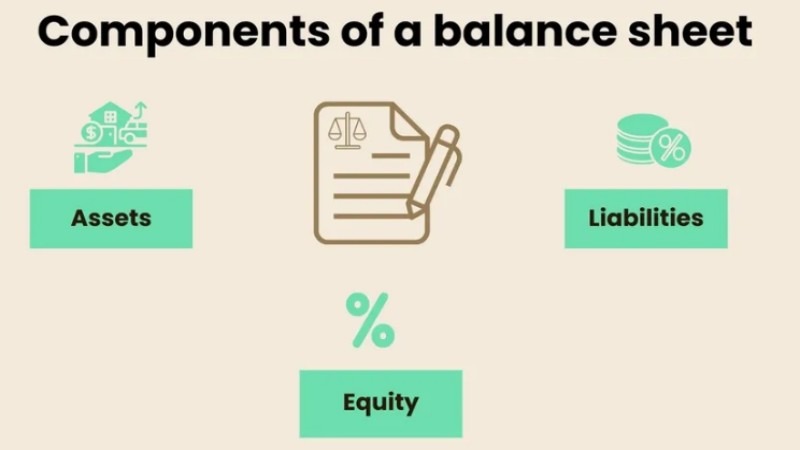
The Three Pillars of the Balance Sheet
To truly understand how to read a balance sheet, you must be intimately familiar with its three core pillars: assets, liabilities, and shareholder’s equity. Let’s break down each component in detail.
Assets: What a Company Owns
Assets are economic resources controlled by the company that have future economic value. They are the things the company uses to operate its business, generate revenue, and create value. On a balance sheet, assets are typically listed in order of liquidity, meaning how quickly they can be converted into cash. They are categorised into two main types: current and non-current.
- Current Assets: These are resources that are expected to be converted into cash or used up within one year or one operating cycle, whichever is longer. They are crucial for funding day-to-day operations.
- Cash and Cash Equivalents: The most liquid of all assets, this includes physical currency, bank deposits, and short-term, highly liquid investments like Treasury bills.
- Accounts Receivable: This represents the money owed to the company by its customers for goods or services that have been delivered but not yet paid for. A significant increase here could signal issues with collecting payments.
- Inventory: This includes raw materials, work-in-progress, and finished goods that the company holds for sale. The value of inventory is critical for retail and manufacturing businesses.
- Non-Current (Long-Term) Assets: These are resources not expected to be converted into cash within one year. They are the long-term investments made by the company to generate value over many years.
- Property, Plant, & Equipment (PP&E): This includes land, buildings, machinery, and vehicles. These assets depreciate over time, and their value on the balance sheet is typically shown net of accumulated depreciation.
- Intangible Assets: These are non-physical assets, such as patents, copyrights, trademarks, and goodwill. Goodwill arises when one company acquires another for a price higher than the fair market value of its tangible assets.
- Long-term Investments: This includes stocks, bonds, or real estate that the company intends to hold for more than a year.
Liabilities: What a Company Owes
Liabilities are a company’s financial obligations or debts to other parties, such as suppliers, lenders, or the government. They represent claims that outsiders have on the company’s assets. Like assets, liabilities are categorised as either current or non-current based on their due date.
- Current Liabilities: These are obligations that are due within one year. Managing current liabilities is essential for a company’s short-term financial health.
- Accounts Payable: This is the money the company owes to its suppliers for goods and services purchased on credit.
- Short-term Debt: This includes loans or other borrowings that must be repaid within one year.
- Accrued Expenses: These are expenses that have been incurred but not yet paid, such as employee wages or taxes.
- Non-Current (Long-Term) Liabilities: These are obligations that are due after one year.
- Long-term Debt: This includes bank loans, mortgages, and other debts that are not due for more than a year.
- Bonds Payable: If a company issues bonds to raise capital, the total amount of those bonds represents a long-term liability.
- Deferred Tax Liabilities: This represents taxes that are owed but are not due for payment until a future date, often due to differences between accounting rules and tax laws.
Shareholder’s Equity: The Company’s Net Worth
Shareholder’s Equity, also known as book value, represents the owners’ stake in the company. It is the residual amount left over for shareholders after all liabilities have been paid off from the assets (Equity = Assets – Liabilities). It is a crucial indicator of the company’s financial health and value.
- Common Stock/Paid-in Capital: This is the total amount of money that shareholders originally invested in the company in exchange for shares of stock.
- Retained Earnings: This is one of the most important components. It represents the cumulative net income the company has earned throughout its history, minus any dividends it has paid out to shareholders. It is the profit that has been ‘retained’ and reinvested back into the business. This account directly links the income statement to the balance sheet.
How to Analyse a Balance Sheet: A Step-by-Step Guide
Reading the balance sheet is just the start. To gain value, you need to analyse it to uncover insights about financial stability, liquidity, and solvency through three key steps.
Step 1: Perform Vertical and Horizontal Analysis
These two techniques provide context to the raw numbers on the balance sheet.
- Vertical Analysis expresses each line item as a percentage of total assets (e.g., cash = 10%, inventory = 25%). This helps identify the relative importance of each account.
- Horizontal Analysis: This involves comparing balance sheet data from different periods (e.g., this year vs. last year, or quarter-over-quarter). By calculating the percentage change in each line item over time, you can spot trends, such as rapidly increasing debt or declining cash reserves.
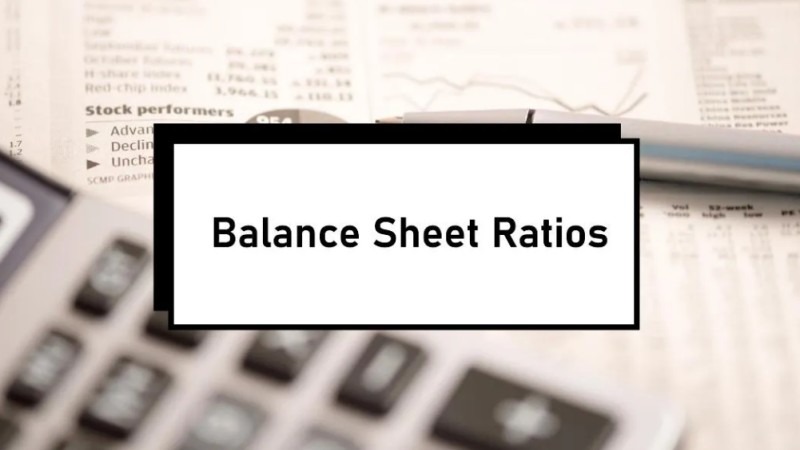
Step 2: Calculate Key Financial Ratios
Financial ratios are powerful tools that use balance sheet figures to provide deeper insights into a company’s performance. They allow for a more standardised comparison across different companies and industries.
| Ratio Name | Formula | What It Measures |
| Current Ratio | Current Assets / Current Liabilities | Measures a company’s ability to pay its short-term obligations. A ratio above 1 is generally considered healthy, suggesting the company has enough liquid assets to cover its immediate debts. |
| Quick Ratio (Acid-Test) | (Current Assets – Inventory) / Current Liabilities | A more stringent liquidity test than the current ratio. It excludes inventory, which can sometimes be difficult to convert to cash quickly. A ratio above 1 is strong. |
| Debt-to-Equity Ratio | Total Liabilities / Shareholder’s Equity | Indicates the proportion of a company’s financing that comes from debt versus equity. A high ratio suggests high financial risk (leverage). |
| Working Capital | Current Assets – Current Liabilities | Represents the capital available for day-to-day operations. Positive and stable working capital is essential for operational smoothness. |
Step 3: Compare Against Industry Benchmarks
The final, crucial step in balance sheet analysis is context. A financial ratio is largely meaningless in isolation. A Debt-to-Equity ratio of 2.0 might be alarmingly high for a software company but perfectly normal for a capital-intensive utility company.
Therefore, it is essential to compare a company’s balance sheet and its derived ratios against those of its direct competitors and the broader industry averages. This comparative analysis helps to determine if the company is performing better or worse than its peers.
Utilizing Ultima Markets for Fundamental Analysis
Understanding financial statements is a cornerstone of fundamental analysis, a skill highly valued by traders and investors. Platforms for trading, such as those provided by reputable brokers, are where this knowledge can be put into practice.
Accessing Financial Data Through Your Trading Platform
As a trusted broker, Ultima Markets provides traders with a robust environment to conduct their market activities. When analysing public companies for stock or CFD trading, traders can find balance sheet information through financial news portals and analytical tools.
Advanced trading platforms like MetaTrader 5 (MT5) often feature integrated news feeds and economic calendars, allowing traders to stay informed and access the data needed to perform fundamental analysis directly within their trading interface.
Applying Balance Sheet Knowledge to Your Trading Strategy
A thorough analysis of the balance sheet can significantly enhance a trading strategy. A company with a strong balance sheet—characterised by low debt, high liquidity, and growing equity—can indicate financial stability.
Such companies may be viewed as potentially less volatile investments or more resilient during economic downturns. This fundamental analysis, championed by clients of brokers with strong reviews, complements technical analysis (the study of price charts and patterns) and is a key part of forming a well-rounded trading approach.
Conclusion
Mastering the ability to read and analyse a balance sheet is crucial for any serious investor, trader, or business enthusiast. It moves you beyond reacting to market noise, enabling decisions based on a solid understanding of a company’s financial foundation.
The balance sheet offers a structured overview of financial health. By understanding its three core components—assets, liabilities, and equity—and learning to analyse them through vertical and horizontal analysis and key ratios, you gain deeper insights. The balance sheet is more than just numbers; it reveals a company’s past decisions, present stability, and future potential.
FAQ
Q: What are the 3 main components of a balance sheet?
A balance sheet is composed of three main parts: Assets (what the company owns), Liabilities (what the company owes), and Shareholder’s Equity (the net worth or owners’ stake). These three components are intrinsically linked by the fundamental accounting equation: Assets = Liabilities + Equity.
Q: Why is it called a ‘balance sheet’?
It is called a balance sheet because it is based on the accounting equation that must always balance. The total value of assets on one side of the sheet must be equal to the combined sum of total liabilities and shareholder’s equity on the other side. This balance is a built-in check to ensure the financial statement is arithmetically correct.
Q: What is the main limitation of a balance sheet?
The primary limitation is that it’s a snapshot at a single point in time. It does not show the flow of finances or performance over a period, which is the purpose of the income statement and cash flow statement. Another limitation is that assets are typically recorded at their historical cost, not their current market value, which can sometimes understate the true value of a company’s holdings, particularly with assets like real estate.
Q: Can a company have negative shareholder’s equity?
Yes, it is possible. If a company’s total liabilities exceed its total assets, shareholder’s equity will be negative. This is a very serious financial situation, often referred to as insolvency or having a deficit. It is a major red flag for investors and creditors as it indicates the company owes more than it owns and may be on the brink of bankruptcy.
Q: What is the difference between a balance sheet and an income statement?
The key difference is what they measure and the time frame they cover. The balance sheet is a snapshot in time (e.g., as of December 31st) showing a company’s assets, liabilities, and equity. In contrast, the income statement (also known as the Profit & Loss or P&L statement) reports a company’s financial performance over a period of time (e.g., for the year ending December 31st) by showing its revenues, expenses, and resulting profit or loss.