Every trader confronts the persistent uncertainty of market direction and the looming risk of sudden, sharp downturns. Whilst no instrument can perfectly predict the future, professional traders rely on a powerful tool to gauge market sentiment and anticipate periods of turbulence. This tool is the VIX Index.
Often dubbed the market’s “fear gauge,” it provides a quantitative measure of expected volatility. This guide offers a comprehensive breakdown of the VIX, explaining how to interpret its signals and use it to make more informed, data-driven trading decisions.
What Exactly Is the VIX Index?
The VIX is the ticker symbol for the CBOE Volatility Index, a real-time index created by the Chicago Board Options Exchange (CBOE). It represents the market’s expectation of 30-day forward-looking volatility for the S&P 500 Index (SPX), the primary benchmark for large-cap US equities.
Simply put, the VIX is calculated using the live prices of a wide basket of S&P 500 index options (both calls and puts). It reflects how much traders are collectively willing to pay for options, indicating the perceived risk.
- A higher VIX value means option prices are expensive, suggesting an expectation of larger price swings (higher volatility) in the S&P 500 over the next 30 days.
- Conversely, a lower VIX value suggests the market anticipates a period of stability.
It is crucial to understand that the VIX is not a measure of historical volatility; it is a forward-looking measure of implied volatility. It captures the current market consensus on the S&P 500’s likely movement in the near future, making it a powerful sentiment indicator.
Why Is the VIX Called the “Fear Index”?
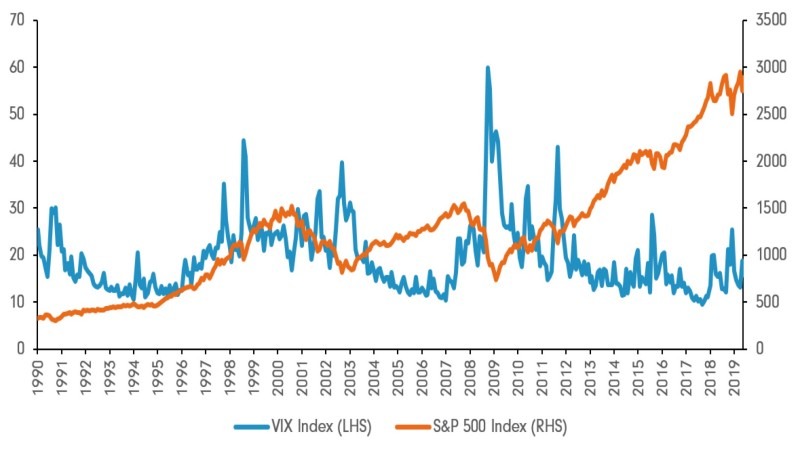
The VIX earned its moniker as the “Fear Index” or “Fear Gauge” due to its strong and historically consistent inverse correlation with the S&P 500 Index. The relationship is rooted in market psychology:
- Low VIX (Low Fear): When the market is calm, stable, and generally rising in a bull market, investor fear is low. There is less demand for portfolio insurance, such as put options. This lower demand keeps option premiums down, which in turn results in a low VIX reading.
- High VIX (High Fear): Conversely, when the market experiences a sharp decline or a sudden shock, fear and panic spread rapidly. Institutional and retail investors rush to buy put options to hedge their portfolios against further losses. This surge in demand for protection drives up the price of options, causing the VIX to spike dramatically.
This dynamic has been proven time and again during major market events. For instance, during the 2008 Global Financial Crisis, as the S&P 500 collapsed, the VIX surged to an all-time intraday high of 89.53. Similarly, during the COVID-19 market crash in March 2020, it peaked above 82, reflecting extreme panic. Even smaller corrections are accompanied by noticeable VIX spikes, confirming its status as a reliable real-time measure of market stress.
How to Read VIX Levels: A Trader’s Cheat Sheet
Interpreting VIX levels allows traders to gauge the current market climate. There are no absolute ‘good’ or ‘bad’ numbers; instead, traders look at specific zones that suggest different levels of risk and opportunity. Understanding these ranges is key to incorporating the VIX into a risk management strategy.
VIX Below 20: Low Volatility & Market Complacency
A VIX reading in this zone, particularly between 12 and 20, generally indicates a stable, low-risk, and calm market environment. These are the typical conditions seen during sustained bull markets where share prices grind higher with minimal pullbacks. Fear is subdued, and investor confidence is high.
However, an extremely low VIX (e.g., below 12) can be a contrarian warning sign. It often signals excessive complacency, meaning the market is not pricing in any potential risks and may be unprepared for a sudden negative catalyst.
VIX Between 20 and 30: Heightened Uncertainty
When the VIX moves into this range, it serves as an amber light for traders. This level signals that uncertainty and investor nervousness are increasing. Traders are beginning to price in a higher probability of significant market moves, both up and down. A VIX in this zone doesn’t necessarily mean a crash is imminent, but it does mean that volatility is picking up. This is a crucial time to review your risk exposure, tighten stop-losses, and perhaps consider implementing protective hedges.
VIX Above 30: High Fear & Potential Opportunity
A VIX reading above 30 indicates significant investor fear and high market volatility. This level is almost always associated with sharp market sell-offs, corrections, or crashes. The market is in a state of distress. Whilst this environment is dangerous for unprepared long-only investors, it can present immense opportunities. For contrarian traders, an extremely high VIX (e.g., above 40 or 50) often signals that peak fear and capitulation selling have been reached. These moments of maximum panic frequently mark a market bottom, creating prime buying opportunities for those with a strong stomach and a long-term perspective.
| VIX Level Range | Market Sentiment | Implied S&P 500 Daily Move (Approx.) | Potential Trader Action |
| Below 12 | Extreme Complacency | +/- 0.75% | Exercise caution; look for signs of reversal. |
| 12 – 20 | Normal/Low Volatility | +/- 0.75% to 1.25% | Standard market conditions; trend-following strategies. |
| 20 – 30 | Heightened Volatility | +/- 1.25% to 1.88% | Increase caution; tighten stops; consider hedging. |
| Above 30 | High Fear/Panic | +/- 1.88% and higher | High risk; look for contrarian buying opportunities. |
Actionable Strategies: How to Trade Using the VIX
It is important to note that you cannot invest in the VIX index directly—it is a mathematical calculation, not a tradable asset. However, traders can use it as a powerful indicator or trade VIX-related financial instruments like futures, options, and Exchange Traded Products (ETPs).
Strategy 1: Hedging an Equity Portfolio
This is a primary use case for institutional investors. If you hold a large portfolio of shares that is highly correlated with the S&P 500 and you anticipate a market downturn, you can hedge your position.
By buying VIX call options or a long-VIX ETP, you create a position that profits from rising volatility. If the market falls as you expect, the VIX will almost certainly rise sharply. The profit generated from your VIX position can then help to offset the losses incurred in your main equity portfolio, cushioning the blow of the downturn.
Strategy 2: Using VIX as a Contrarian Indicator
This strategy revolves around the famous adage, “Be fearful when others are greedy and greedy when others are fearful.” The VIX provides a direct measure of market fear and greed (complacency).
- Buy Signal: When the VIX spikes to extreme highs (e.g., above 40 or 50), it suggests widespread panic and indiscriminate selling. This is often the point of maximum pessimism, where assets are oversold. For long-term investors, this can present a generational buying opportunity to accumulate quality assets at a significant discount.
- Sell/Caution Signal: When the VIX falls to extreme lows (e.g., below 12), it indicates extreme complacency and a lack of perceived risk. This can be a sign that the market is overbought and vulnerable to a correction. In such an environment, prudent traders might consider taking some profits off the table, tightening their stop-loss orders, or avoiding initiating large new long positions.
Applying VIX Insights with Ultima Markets
Modern brokerage platforms provide the tools to act directly on the insights gleaned from the VIX. For example, traders using Ultima Markets can speculate on market direction through Contracts for Difference (CFDs) on major indices like the S&P 500 (US500) and NASDAQ 100 (USTEC).
By monitoring the VIX, a trader can make more informed decisions. A rising VIX might support a decision to open a short CFD position on the US500, anticipating a market decline. Conversely, a low and stable VIX might provide the confidence needed to maintain a long position, expecting the calm trend to continue. Ultima Markets offers the MT5 platform, with a focus on fund safety and reliable Deposits & Withdrawals. You can also view Ultima Markets Reviews.
Understanding the Risks of VIX ETFs and ETNs
Whilst popular products like VXX (an ETN) and UVXY (an ETF) allow for easy access to VIX exposure, they are highly complex and carry significant risks. They are designed for sophisticated, short-term trading, not long-term investment. The primary reason is that they do not track the VIX index itself. Instead, they track a rolling basket of VIX futures contracts.
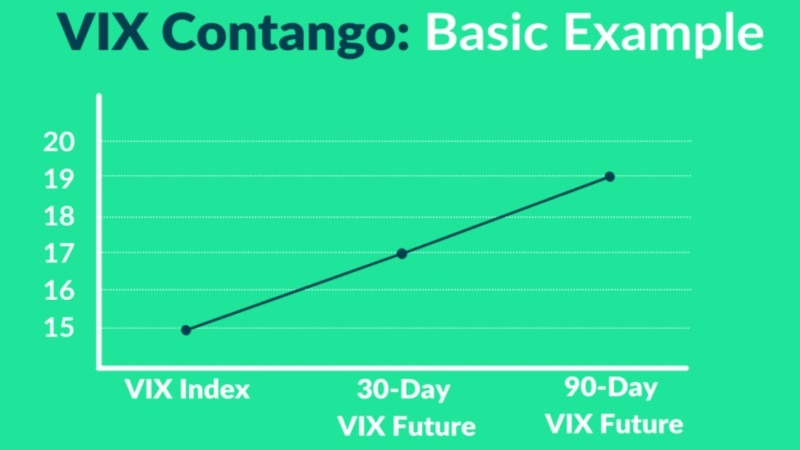
This exposes them to a phenomenon known as “contango.” In most market conditions, VIX futures for a later month are more expensive than for the current month. To maintain exposure, these ETPs must constantly sell the expiring (cheaper) front-month contract and buy the next (more expensive) contract. This “rolling” process creates a persistent drag on their price, known as negative roll yield. Over time, this almost guarantees that these products will lose value, making them entirely unsuitable for a buy-and-hold strategy.
Conclusion: Making Smarter Decisions with the VIX
The VIX index is an indispensable tool for the modern trader, offering a clear, data-driven window into market sentiment. It allows you to move beyond emotional reactions and assess the true level of fear or complacency driving price action. By mastering its signals, you can enhance your situational awareness and decision-making process.
- Key Takeaway: Consistently use the VIX as your market “fear gauge.” A low VIX signals complacency and potential over-confidence, whilst a high VIX signals panic and potential opportunity.
- Actionable Advice: Make checking the VIX a non-negotiable part of your pre-trade routine. Use its level to confirm or challenge your market thesis, manage your risk exposure, and identify potential entry points that others, blinded by fear or greed, might miss. By understanding the VIX Index, you can navigate volatility with greater confidence and strategic precision.
FAQ
Q: What is a “good” VIX number?
There is no single “good” number, as its interpretation depends entirely on your trading strategy and market outlook.
- For a long-term investor holding a diversified portfolio, a low VIX (typically 12-20) is generally “good” as it signals stable, bullish conditions.
- For a short-term volatility trader or a contrarian investor, a high VIX (above 30) can be “good” because it presents opportunities to profit from large price swings or to buy assets at depressed prices.
Q: Can the VIX go to zero?
No, the VIX cannot go to zero. The mathematical formula used for its calculation makes a zero reading virtually impossible. A value of zero would imply that every single market participant expects zero future volatility—meaning no price movement at all. In the dynamic world of financial markets, this is an unrealistic expectation. Historically, the VIX has a floor in the high single digits (around 8-9), but it has never approached zero.
Q: How is the VIX calculated in simple terms?
While the official CBOE formula is complex, the underlying concept is straightforward. The VIX calculation aggregates the prices of a vast number of S&P 500 options with near-term expiration dates, specifically looking at out-of-the-money puts and calls.
By averaging the weighted prices of these options, it derives the market’s consensus on the expected range of movement for the S&P 500 over the next 30 days. It essentially reverse-engineers volatility expectations from what traders are actually paying for options in real-time.
Q: Is the VIX a reliable predictor of market crashes?
The VIX is not a predictive tool or a crystal ball for forecasting market crashes. It is a concurrent indicator, meaning it reflects the current state of market fear. A rapidly rising VIX often happens at the same time as a market sell-off; it does not predict that a sell-off will occur next week or next month. Think of it as a thermometer for market health: a high temperature (high VIX) tells you the market is sick now, but it didn’t predict the illness in advance.
Q: What is the difference between VIX and VXX?
This is a critical distinction. The VIX is an index—a theoretical number calculated from option prices. You cannot buy or sell the VIX directly. The VXX is an Exchange Traded Note (ETN), which is a type of debt security. It is a financial product designed to track the performance of a basket of short-term VIX futures contracts. VXX is a tradable asset, but its price movement does not perfectly mirror the VIX index due to factors like the cost of rolling futures contracts (contango), which causes its value to decay over time.