
As an investor, you need a quick, reliable way to assess a company’s financial health and profitability. Among many ratios, experienced investors on platforms like Ultima Markets Reviews rely on one key measure — Return on Equity (ROE).
It shows how effectively management uses shareholders’ money to generate profits. Understanding ROE helps you look beyond share prices to see real business performance. This guide covers everything from the ROE formula to DuPont analysis, equipping you to spot strong investments and make informed financial decisions.
What Exactly is Return on Equity (ROE)?
Return on Equity (ROE) measures how much profit a company generates from shareholders’ equity — essentially, how efficiently management turns investment into earnings. A higher ROE means capital is being used effectively to grow the business and create value.
For example, if a manager turns £100 into £115 in a year, that’s a 15% return; ROE applies the same principle at a company level, showing how well management converts equity into net income.
How to Calculate Return on Equity: The Formula Explained
Return on Equity is calculated using two key figures:
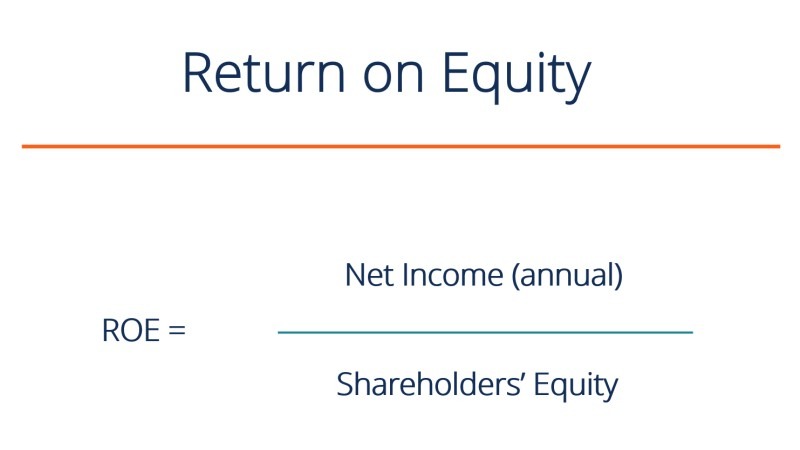
ROE = (Net Income / Average Shareholder Equity) × 100%
Net Income comes from the Income Statement — profit after all expenses, interest, and taxes, typically over a full year (or TTM).
Shareholder Equity is from the Balance Sheet — Total Assets minus Total Liabilities, showing the net worth of the company. Because equity is a snapshot while income spans a period, the average equity is used for accuracy:
(Average Equity = Beginning Equity + Ending Equity) / 2
Example:
Innovate PLC earned $20M in 2024, with equity rising from $90M to $110M.
Average Equity = $100M → ROE = ($20M / $100M) × 100% = 20%.
This means each dollar of shareholder equity generated $0.20 in profit.
What is a Good Return on Equity?
A higher ROE is generally better, but “good” depends on context.
General Benchmarks
• 15–20%: strong, consistent profitability
• Below 10%: low efficiency or tough industry
• 12–14%: market average, acceptable but not outstanding
• 20%+: durable competitive advantage
• 40–50%+: treat with caution—may stem from one-off gains or high debt.
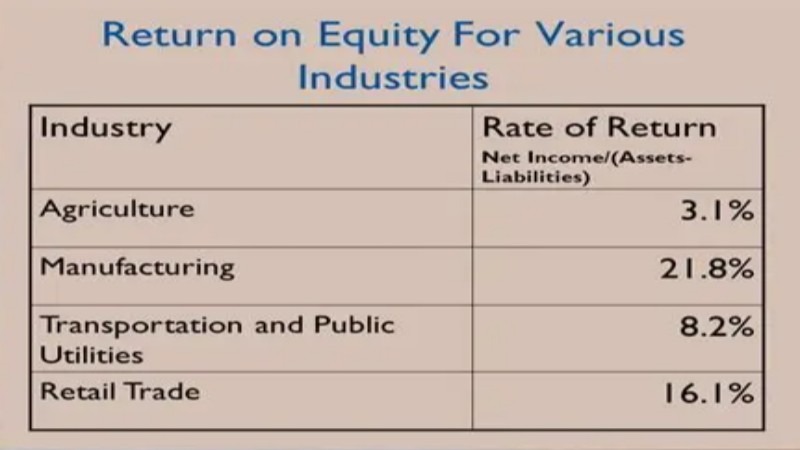
Industry Comparison
Compare ROE within the same industry. Tech firms often post 20%+ due to low assets; utilities may only reach 8–12% because of heavy infrastructure. Always interpret within sector context.
| Industry Sector | Typical ROE Range | Reason |
| Technology (Software/SaaS) | High (20%+) | Low asset base, high-profit margins, scalable business models. |
| Utilities (Energy/Water) | Low (8-12%) | Asset-heavy (high equity base), regulated market, stable but slow profit growth. |
| Consumer Discretionary (Retail) | Moderate (15-25%) | Dependent on inventory turnover, brand strength, and profit margins. |
| Financials (Banking) | Moderate (10-15%) | Highly leveraged by nature, with regulations requiring certain capital levels. |
| Pharmaceuticals | Varies Widely (15-30%) | High R&D costs but protected by patents, leading to high margins on successful drugs. |
Why ROE is a Crucial Metric for Investors
ROE reveals profitability, management quality, and competitive strength.
Profitability
Rising ROE means improved profit conversion—better margins or efficiency.
Management Efficiency
Stable ROE shows capable leadership allocating capital effectively. A falling ROE warns of poor investments or declining profits.
Competitive Advantage
Companies maintaining 20%+ ROE for years often have a “moat”—brand, patents, or cost advantage enabling sustained profit.
The DuPont Analysis: A Deeper Look into ROE
While ROE is a powerful metric, it doesn’t tell the whole story. A company could have a high ROE for good reasons (high profitability) or bad reasons (too much debt). The DuPont analysis, developed by the DuPont Corporation in the 1920s, is a framework that breaks down ROE into three distinct components. This allows investors to understand *what* is driving the Return on Equity.
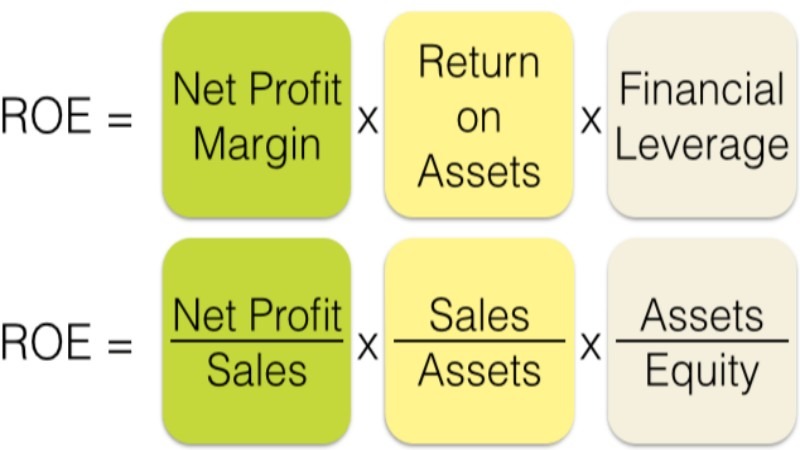
ROE = (Profit Margin) x (Asset Turnover) x (Financial Leverage)
Component 1: Net Profit Margin
Formula: Net Income / Revenue
This ratio measures operational efficiency and pricing power. It tells you how much profit a company makes for every dollar of sales. A high net profit margin is desirable, indicating the company is effective at controlling its costs and/or commands a premium price for its products or services.
Component 2: Asset Turnover
Formula: Revenue / Average Total Assets
This ratio measures how efficiently a company is using its assets to generate revenue. A higher asset turnover ratio implies the company is getting more sales from every dollar of assets it owns (factories, equipment, inventory). It’s a key indicator of asset management efficiency.
Component 3: Financial Leverage
Formula: Average Total Assets / Average Shareholder Equity
This ratio, also known as the equity multiplier, measures how much debt a company is using to finance its assets. A higher number indicates greater leverage. While leverage can amplify returns (and thus boost ROE), it also significantly increases financial risk. If a company’s profits decline, a high level of debt can quickly become a major problem.
By breaking ROE down, you can compare two companies with the same 20% ROE and see they are achieving it in very different ways. One might have a high-profit margin and low debt, while the other has thin margins but uses a lot of debt. The former is generally a much safer and higher-quality business. This level of analysis is common for traders using sophisticated platforms like Ultima Markets MT5.
Comparing ROE with Other Key Metrics: ROA and ROI
To get a full picture, it’s wise to use ROE in conjunction with other metrics, particularly Return on Assets (ROA) and Return on Investment (ROI).
| Metric | Formula | What it Measures | Key Difference from ROE |
| Return on Equity (ROE) | Net Income / Shareholder Equity | Profitability relative to the shareholders’ stake. | Focuses only on the return to equity holders and is influenced by debt. |
| Return on Assets (ROA) | Net Income / Total Assets | Profitability relative to all company assets, regardless of financing. | Includes assets financed by both debt and equity, giving a view of how well a company uses all its resources. ROA is not affected by leverage in the same way as ROE. |
| Return on Investment (ROI) | (Net Profit from Investment / Cost of Investment) x 100 | Measures the gain or loss on a specific investment. | ROI is a much broader and more flexible term. It can be used to evaluate a single project, a stock purchase, or a marketing campaign. ROE is a specific corporate finance metric for the entire company. |
Potential Limitations and Pitfalls of ROE
No single metric is perfect. To conduct a thorough analysis and ensure you make sound decisions about your deposits & withdrawals, you must be aware of the limitations of Return on Equity.
Distortions from High Debt
This is the most significant pitfall. A company can artificially inflate its ROE by taking on excessive debt. Since Shareholder Equity = Assets – Liabilities, increasing liabilities (debt) reduces the equity denominator in the ROE formula.
This mechanically pushes the ROE figure higher, even if profitability has not improved. This creates a riskier investment, as the company is more vulnerable to economic downturns.
Impact of Share Buybacks
When a company buys back its own shares, it reduces the amount of shareholder equity on the balance sheet. Similar to taking on debt, this shrinks the denominator of the ROE calculation and can inflate the result.
While share buybacks can be a good sign, it’s important to verify that the ROE is rising due to genuine profit growth, not just financial engineering.
Negative Net Income or Equity
The Return on Equity metric is meaningless for companies that are unprofitable (negative net income) or have negative shareholder equity. In these cases, the calculation produces a negative or nonsensical number, providing no useful information for analysis. This is common for young, high-growth startups or companies in severe financial distress.
Conclusion
Return on Equity remains a key profitability metric. Understand its formula, compare with industry peers, and use tools like DuPont and ROA for context. As Ultima Markets advises, focus on consistent, sustainable ROE to find high-quality, long-term investments.
FAQ
Q:Is a higher Return on Equity always better?
Not always. Extremely high ROE (40%+) may reflect one-off gains or excessive leverage. Consistency and quality matter more than a single high figure.
Q:What can cause a negative ROE?
A company with positive equity but net loss will show negative ROE, meaning it’s not profitable.
Q:What is the difference between ROE and ROA (Return on Assets)?
ROE measures return to shareholders; ROA measures return on all assets. A large gap (high ROE, low ROA) indicates heavy debt use.
Q:Can ROE be used to predict future growth?
To some extent. High ROE means more profit per unit of equity. Reinvested earnings fuel sustainable growth without new capital.
Q:How does Return on Equity differ from Return on Investment (ROI)?
ROI measures returns on specific investments or projects; ROE applies to the company as a whole from shareholders’ perspective.