
Stock prices fluctuate, but efficiency is revealed through ratios like ROA. Understanding the return on assets formula shows how well management uses assets to generate profit, helping traders spot financially strong companies and avoid hidden risks.
What is the Return on Assets (ROA) Formula?
The return on assets formula is a profitability ratio that measures how much profit a company generates for each dollar of its assets. In essence, it is the ultimate report card on managerial effectiveness and asset efficiency.
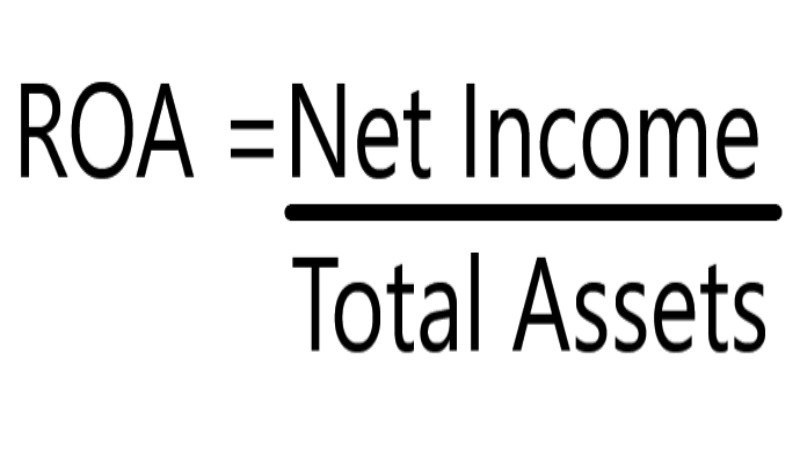
The formula is expressed as:
ROA = Net Income / Average Total Assets
This figure, presented as a percentage, provides a clear view of a company’s operational performance. For traders using fundamental analysis to select stocks, a consistently high or improving ROA is a strong bullish indicator. It suggests that the management team is adept at allocating capital and squeezing profits from its resource base.
A higher ROA signifies that a company requires less asset investment to generate a given level of profit, which points towards a leaner, more efficient business model. This efficiency can translate into sustainable earnings growth and, consequently, a rising share price.
Breaking Down the Formula Components
To correctly apply the return on assets formula, you must understand its two key components, both of which are found in a company’s financial statements.
- Net Income: This is a company’s total profit after all operating expenses, interest, and taxes have been subtracted from its total revenue. Often referred to as the ‘bottom line’, it represents the pure profit attributable to shareholders. You can find this figure on the company’s Income Statement (also known as the Profit and Loss statement). It is crucial to check for any large, one-off items that might distort the net income figure, as you are looking for profitability from core operations.
- Average Total Assets: This component represents the average value of a company’s assets over a specific period, usually a year. It is calculated to smooth out any significant fluctuations that might occur from a large asset purchase or sale near the end of the accounting period. You calculate it by adding the total assets from the beginning of the period to the total assets at the end of the period, and then dividing by two. The total asset figures are found on the company’s Balance Sheet. The formula is:
Average Total Assets = (Beginning Total Assets + Ending Total Assets) / 2
How to Calculate ROA in 3 Simple Steps (With a Real Example)
The direct method for calculating ROA is to locate the Net Income on the income statement and divide it by the Average Total Assets derived from the balance sheets. Let’s walk through a practical example using a hypothetical tech firm, ‘Innovate Corp’.
Step 1: Find the Net Income
First, you must examine Innovate Corp’s most recent annual income statement. Locate the ‘Net Income’ line. For our example, let’s assume their Net Income for the fiscal year 2025 was $50 million.
Step 2: Calculate Average Total Assets
Next, you need the company’s balance sheets for the end of the 2025 fiscal year and the end of the 2024 fiscal year. Find the ‘Total Assets’ line item on both documents.
- End of 2025 Total Assets: $420 million
- End of 2024 Total Assets: $380 million
Now, apply the average assets formula:
Average Total Assets = ($420 million + $380 million) / 2 = $400 million
Step 3: Apply the Return on Assets Formula
With both figures, you can now complete the calculation using the return on assets formula:
ROA = $50 million / $400 million = 0.125
To express this as a percentage, multiply by 100. Innovate Corp’s ROA is 12.5%. This result means that for every dollar of assets the company controls, it generates 12.5 cents in net profit. This is a crucial piece of data for any trader.
Why ROA is a Critical Metric for Traders
For traders, ROA is far more than a simple accounting metric; it is a powerful lens through which to view a company’s operational prowess and the quality of its management. A consistently high or upward-trending ROA often signals a company with a strong competitive advantage, or ‘economic moat’. It demonstrates that management is not just growing the business, but doing so profitably and efficiently.
This can lead to sustainable earnings growth, which is a primary driver of long-term share price appreciation. Conversely, a declining ROA can be a significant red flag, suggesting that the company’s competitive edge is eroding, it is facing operational headwinds, or its management is making poor capital allocation decisions.
Monitoring the ROA trend over several quarters or years provides a dynamic view of a company’s financial health, a perspective that is often more valuable than a single snapshot in time. A broker like Ultima Markets provides access to tools that can help track these fundamental metrics over time.
ROA vs. ROE: Which Metric Should Traders Prioritise?
The most effective approach is to use both metrics in conjunction, as they tell different but complementary stories about a company’s performance. The return on assets formula assesses efficiency using all of a company’s resources (assets), regardless of how they are financed. In contrast, Return on Equity (ROE) focuses solely on the returns generated for the shareholders’ portion of the capital. The key difference lies in the treatment of debt.

| Feature | Return on Assets (ROA) | Return on Equity (ROE) |
| Formula | Net Income / Average Total Assets | Net Income / Shareholder Equity |
| What it Measures | How efficiently a company uses all its assets (both debt and equity financed) to generate profit. | How efficiently a company uses money invested by its shareholders to generate profit. |
| Impact of Debt | Less directly influenced. A company cannot easily inflate its ROA with debt. It provides a purer view of operational efficiency. | Highly influenced. A company can increase its ROE by taking on more debt (financial leverage), which can be risky. |
| Trader’s Insight | Best for assessing core operational efficiency. Excellent for comparing companies within the same capital-intensive industry. | Best for understanding profitability from a shareholder’s perspective. A high ROE should be scrutinised; if driven by high debt while ROA is low, it is a warning sign. |
A company can have a low ROA but a high ROE. This scenario typically arises when the company employs significant financial leverage (debt). While this might appear attractive to shareholders initially, it introduces higher risk. If the company’s profits falter, it still must service its debt, which can quickly erode shareholder value. Therefore, a trader should always analyse ROA alongside ROE to get a complete picture of profitability and risk.
What is a Good Return on Assets? Industry Benchmarks Matter
There is no single number that defines a ‘good’ ROA; it is highly context-dependent and varies significantly across industries. This is because different sectors have inherently different business models and asset requirements.
An ROA of 5% might be outstanding for a capital-intensive utility company but would be considered poor for an asset-light software firm. As a general guideline, an ROA above 5% is often seen as reasonable, while an ROA exceeding 20% is typically considered excellent. However, the most meaningful analysis comes from comparing a company’s ROA to its direct competitors and its own historical trend.

ROA Benchmarks for Key Sectors
Understanding typical ROA ranges for different industries is essential for proper analysis. Using advanced platforms such as Ultima Markets MT5 can provide traders with the tools to analyse and compare these metrics across sectors.
- Technology (e.g., Software-as-a-Service): These companies often have very high ROA values (frequently 15%+) because their primary assets are intangible (intellectual property, code) and they don’t require large physical plants or inventory.
- Manufacturing & Industrials: These sectors are asset-heavy, requiring significant investment in factories, machinery, and equipment. Consequently, they typically have lower ROA figures, often in the 5% to 10% range.
- Banking & Financial Services: Banks have massive balance sheets filled with assets like loans and investments. Their profit margins on these assets are very thin, leading to extremely low ROA values, often around 1% to 2%.
- Retail: This sector can vary widely. Efficient retailers with strong inventory management and brand loyalty can achieve healthy ROA in the 8% to 15% range, while less efficient players may struggle with much lower figures.
- Utilities: As providers of essential services like electricity and water, these companies operate vast infrastructure networks. This capital-intensive nature means their ROA is typically low, often between 2% and 5%.
The Limitations of the Return on Assets Formula
The primary limitation of the return on assets formula is its ineffectiveness for comparing companies across different industries. As highlighted above, varying asset bases make such comparisons meaningless. Traders must recognise this and other limitations to avoid drawing incorrect conclusions.
For example, a tech company’s ROA cannot be directly compared to a bank’s. Furthermore, ROA can be distorted by accounting conventions, such as depreciation methods, which can affect the book value of assets. It may also fail to capture the value of intangible assets like brand reputation, patents, or a skilled workforce, which are not always fully reflected on the balance sheet but are critical drivers of profit. Finally, remember that ROA is a historical measure; while it provides valuable insight into past performance, it is not a guarantee of future results.
Conclusion: Making Actionable Decisions with ROA
For any serious trader, the return on assets formula is an indispensable tool in the fundamental analysis toolkit. It cuts through market noise to provide a clear, objective measure of a company’s operational efficiency and management quality. By integrating ROA into your analytical process, you can make more informed and confident trading decisions. Reading broker assessments like Ultima Markets Reviews can also provide context on the tools and resources available for such analysis.
Key Actionable Takeaways for Traders:
- Always Compare Like-for-Like: Only use ROA to compare direct competitors within the same industry to ensure a meaningful analysis.
- Track the Trend: An improving ROA over several quarters is a much stronger bullish signal than a single period’s high number. It indicates positive momentum in operational efficiency.
- Use in Conjunction with Other Ratios: Never rely on ROA in isolation. Combine it with ROE, profit margins, and cash flow metrics for a comprehensive, 360-degree view of a company’s financial health. It’s also vital to consider the fund safety of your investments.
- Actionable Trading Signal: Before entering a long position, check the company’s ROA and its recent trend. A stable or increasing ROA can strengthen your conviction in the trade. Conversely, a declining ROA should prompt a deeper investigation into the company’s health before you commit capital. Ensure your broker offers efficient Deposits & Withdrawals to act on your decisions promptly.
FAQ
Q:Can a company have a high ROE but a low ROA?
Yes, absolutely. This is a classic sign of high financial leverage. It means the company is using a significant amount of debt to finance its assets. While the returns to shareholders (ROE) may look impressive, the low ROA reveals that the underlying business operations are not particularly efficient. This is a potential red flag for traders, as high debt levels increase financial risk, especially during economic downturns.
Q:How is ROA used in DuPont analysis?
DuPont analysis is a framework that deconstructs ROE into three core components: Net Profit Margin, Asset Turnover, and Financial Leverage. The return on assets formula is actually embedded within this analysis. Specifically, ROA is the product of the first two components: Net Profit Margin (Net Income / Revenue) multiplied by Asset Turnover (Revenue / Average Total Assets). This demonstrates that ROA is a fundamental driver of a company’s overall return to shareholders.
Q:What is the main difference between ROA and ROI?
While both measure returns, they have different scopes. Return on Assets (ROA) is a holistic company-wide metric that measures profitability relative to the company’s entire asset base. Return on Investment (ROI), on the other hand, is much more specific. It is used to evaluate the profitability of a particular investment or project, calculated as (Net Profit from Investment / Cost of Investment). A company uses ROA to assess its overall efficiency, while a manager might use ROI to decide whether to proceed with a specific project, like opening a new factory.
Q:Where can I find the data to calculate the return on assets formula?
All the necessary data is publicly available in a company’s financial statements, which are typically released quarterly and annually. You can find the Net Income figure on the Income Statement and the Total Assets figures on the Balance Sheet. These reports are usually available on the company’s investor relations website or through financial regulatory bodies. Additionally, most financial data platforms and high-quality trading terminals provide pre-calculated ratios, saving you the manual effort.
Q:Is a negative Return on Assets always a bad sign?
Yes, a negative ROA is a definitive negative indicator. It means the company has a negative net income (a net loss) for the period. This indicates that the company is not only failing to generate a profit from its asset base but is actively losing money. For traders, a negative ROA is a significant warning sign of financial distress and severe operational inefficiency, warranting extreme caution.
*This article represents the author’s personal views only and is for reference purposes. It does not constitute any professional advice.
