The short answer to why is WTI trading above Brent in 2026 is that this market event is fundamentally a story about pricing mechanics and curve structure, and only secondarily a narrative about benchmark hierarchy. The inversion seen this year reflects an intensely distorted front-end of the oil futures curve, driven by acute physical scarcity, rather than a permanent reshuffling of the global crude order.
For traders, understanding this distinction is the key to navigating a market where the headline price of oil is telling only a fraction of the story. This analysis will dissect precisely what traders need to know about the WTI-Brent spread right now and why this market anomaly occurred.
Table of Contents
WTI Trading Above Brent Is a Pricing Story, Not a Benchmark Story
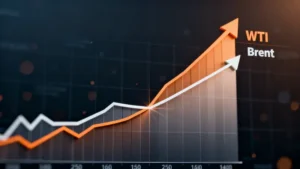
The first and most critical point for any market participant is to separate market mechanics from market mythology. A rare price inversion where West Texas Intermediate (WTI) crude futures trade at a premium to Brent crude is visually dramatic. On April 2nd, 2026, front-month WTI settled at $111.54 per barrel, while Brent was at $109.03. By April 7th, WTI was approaching $116 while Brent hovered near $111. However, concluding that Brent has lost its status as the global benchmark is a misinterpretation of the data.
A more practical and accurate reading is that the front of the WTI futures curve became so severely distorted by supply-chain stress that nearby barrels temporarily outperformed their Brent counterparts in flat price terms. This wasn’t a signal that the market suddenly deemed WTI a superior long-term benchmark.
Instead, it was a loud and clear message that accessible, refinery-ready barrels in the U.S. Gulf Coast had become exceptionally valuable during a period of intense global supply disruption. Authoritative reporting from sources like Reuters showed that U.S. crude spot premiums climbed to record levels as refiners in both Asia and Europe competed fiercely for replacement barrels. This confirms the inversion was rooted in prompt-month stress, not a permanent benchmark reset.
The Contract Structure: What Most Headlines Miss
Before drawing any macroeconomic conclusions, a professional trader analyzing why WTI is trading above Brent must start with the mechanics of the futures contracts themselves. The nuances of contract structure are often the first and most important detail that mainstream headlines overlook, leading to flawed analysis.
Why Front-Month Comparisons Can Mislead
Front-month futures contracts are instruments that measure urgency as much as they measure the price of oil. During periods of acute supply scarcity, the prompt (nearest delivery) contract can move far more aggressively than contracts for delivery in later months. This phenomenon, known as steep backwardation, makes simple comparisons between the front-month WTI and front-month Brent contracts notoriously noisy and potentially deceptive.
In early April 2026, the surge in U.S. spot premiums directly followed a significant widening of the prompt monthly WTI futures spread (M1-M2). This was a clear signal from within the market structure itself: the nearest deliverable barrels at the Cushing, Oklahoma hub and for export from the Gulf Coast carried an extraordinary premium. The headline inversion was merely the final symptom of this underlying structural tension.
Why Same-Delivery Comparisons Are More Accurate
A much cleaner and more intellectually honest method for judging the true relationship between the benchmarks is to compare contracts for the same delivery month. This approach strips out much of the distortion caused by a front-month squeeze and provides a clearer view of whether the underlying value of U.S. crude has fundamentally flipped relative to North Sea crude. For a deeper dive, our oil commodity spread trading guide offers more detailed strategies.
This framing aligns with the broader institutional view, such as that from the U.S. Energy Information Administration (EIA), which, in its latest outlook, continues to project that Brent will maintain its typical premium to WTI over the long term. The EIA’s analysis suggests the spread will narrow as the acute supply disruptions ease, reinforcing the idea that the 2026 inversion is a temporary dislocation, not a permanent state change.
| Comparison Method | What It Usually Tells You |
|---|---|
| WTI Front Month (M1) vs. Brent Front Month (M1) | Can exaggerate the inversion during periods of extreme prompt tightness. Reflects immediate logistical stress and scarcity more than fundamental value. |
| WTI Second Month (M2) vs. Brent Front Month (M1) | Often provides a fairer comparison during a front-month squeeze, as it aligns delivery windows more closely and mitigates the effect of prompt-date panic. |
| Same-Delivery-Month Comparison (e.g., WTI June vs. Brent June) | The most accurate test of whether the intrinsic benchmark premium has actually flipped, removing distortions from differing contract expiration cycles. |
Backwardation: How Scarcity Turned Prompt Oil Into a Premium Trade
To truly grasp why WTI is trading above Brent, one must understand how prompt barrels were transformed into a scarcity-driven premium trade. This is a classic case of severe backwardation, where the market is willing to pay a significant premium for immediate delivery over delivery in the future.
The Aggressive Repricing of Near-Term Barrels
A major supply shock does not impact all points on the futures curve equally. The market’s first reaction is almost always concentrated in the nearest-dated contracts, as these represent the barrels that refiners and physical traders need immediately to keep operations running. In 2026, this is precisely why prompt WTI futures were bid up so aggressively. The market wasn’t repricing all WTI for all time; it was repricing the barrels that could be delivered *now*.
The monthly WTI prompt spread (the difference between the first and second month contracts) widened dramatically as buyers scrambled for immediate supply. This dynamic pushed up spot values on the U.S. Gulf Coast, causing the front of the WTI curve to detach from its normal behavior as a benchmark and begin acting like an emergency supply instrument.
Why Futures Spreads Matter More Than Flat Price Headlines
Experienced commodity traders instinctively trust signals from spreads before they trust headlines about flat prices. A flat price inversion is eye-catching and makes for good news copy, but it lacks nuance. Spreads, however, reveal the market’s inner workings—they tell you whether a price move is driven by broad demand shifts, structural supply scarcity, or a temporary delivery squeeze.
This distinction is paramount in the 2026 WTI-Brent inversion. The physical market and the prompt futures structure were both screaming scarcity in unison. The inversion was not a phantom anomaly on a trading screen; it was confirmed by the very shape of the futures curve. For those unfamiliar with this concept, we recommend understanding backwardation in futures markets to appreciate its significance.
The Physical Market Signal: From Futures to Reality
A robust analysis of why WTI is trading above Brent cannot stop at the futures market. The physical market is where paper contracts are converted into wet barrels, and its signals in 2026 confirmed that the stress was undeniably real.
How U.S. Spot Premiums Reached Record Highs
On-the-ground reporting provided the clearest evidence. A Reuters report on April 6, 2026, detailed how spot premiums for U.S. physical crude grades climbed to record highs as refiners from Asia and Europe competed intensely for available cargoes. Offers for WTI Midland crude delivered to North Asia for July loading were reported at staggering premiums of $30 to $40 per barrel above Brent- or Dubai-linked benchmarks. In Europe, the pricing for similar U.S. barrels reached around a $15 per barrel premium to Brent.
Why Refiners Were Willing to Pay the Premium
This was not typical speculative behavior. It was the rational action of commercial players—refineries—facing a critical need to secure deliverable replacement barrels at a time when other major supply channels were impaired. The market was placing an immense value on crude that could be reliably sourced, loaded onto a tanker, and processed.
Refiners were bidding aggressively for barrels across the Atlantic Basin because the pool of available alternatives had shrunk dramatically. This real-world scramble for physical supply provides one of the strongest explanations for why WTI traded above Brent in this crisis environment.
U.S. Crude as the Global Relief Valve
The price inversion becomes far more logical when U.S. crude is viewed not just as a domestic benchmark, but as a crucial relief valve for a stressed global energy system. The United States’ robust production and export infrastructure allowed it to become the marginal supplier to the world during the disruption.
How Europe and Asia Competed for the Same Barrels
The core of the issue was a global bidding war. Reports described a market where European and Asian buyers were simultaneously competing for the same pool of non-Middle East cargoes, with U.S. barrels being the most readily available option. This intense competition pulled WTI-linked supply out of its typical U.S. pricing framework and into the global arena, forcing its price to reflect international, rather than just domestic, fundamentals.
Why Freight and Accessibility Made U.S. Oil More Attractive
In a crisis, accessibility commands a premium. A barrel that is visible, loadable from a reliable port, and logistically flexible can trade at a very different price from a benchmark barrel that may seem cheaper on paper but is harder to secure in practice.
Tight tanker availability and surging freight costs further compounded the scramble, pushing the delivered cost of U.S. crude even higher. Therefore, the answer to why is WTI trading above Brent was not just about crude quality, but also about transportation, logistics, and execution risk.
A Trader’s Playbook: How to Analyze WTI vs. Brent in a Crisis
For traders, interpreting the WTI-Brent relationship during a crisis requires a more sophisticated framework than simply looking at the flat price. Here is a practical, step-by-step playbook for a more robust analysis.
- Step 1: Compare the Correct Contract Months. Do not rely solely on the front-month vs. front-month comparison. Align the delivery windows by comparing same-month contracts (e.g., June WTI vs. June Brent) to determine if the fundamental value proposition has truly inverted.
- Step 2: Monitor M1-M2 Backwardation. If the spread between the first-month (M1) and second-month (M2) WTI contracts remains extremely wide, it indicates that near-term scarcity is still the primary driver. This tells you the inversion is being powered by urgency, not a long-term structural shift.
- Step 3: Confirm with Physical Premiums. If spot premiums for physical U.S. grades like WTI Midland remain at record highs, the move is not just a futures market screen effect. It has a real-world, commercial foundation.
- Step 4: Track Freight, Exports, and Refinery Activity. If freight costs remain elevated, U.S. crude export volumes stay strong, and refiners continue paying high premiums for alternative barrels, the inversion has a solid physical underpinning. If these indicators begin to cool, the pricing anomaly is more likely to fade.
| Indicator | Status: Hot (Supports WTI Premium) | Status: Cooling (Undermines WTI Premium) |
|---|---|---|
| WTI M1-M2 Spread | Wide Backwardation (>$2.00) | Narrowing or Contango |
| U.S. Physical Premiums | Record Highs vs. Brent/Dubai | Returning to historical norms |
| U.S. Crude Exports | Sustained High Volumes (>4.5 mbpd) | Declining toward seasonal averages |
| Trans-Atlantic Freight Rates | Elevated / Volatile | Stabilizing / Decreasing |
What Could End the WTI Premium Over Brent?
Traders asking why WTI is trading above Brent are equally interested in what conditions would cause this anomaly to end. The normalization of the spread hinges on the reversal of the factors that created it.
- An Easing of the Physical Market Panic: Once global refiners secure their immediate cargo needs and feel less urgency, spot premiums will likely fall rapidly. This would remove a key pillar supporting prompt WTI prices.
- A Cooling of the Prompt Spread: A significant narrowing of the WTI M1-M2 spread would be a primary signal that the acute scarcity of nearby barrels is fading, making a sustained inversion less probable.
- An Improvement in Global Alternative Supply: Increased availability of other Atlantic Basin crudes or the smoother flow of substitute barrels from other regions would reduce the unique premium attached to flexible U.S. supply.
- A Fading of the Shipping Risk Premium: A return to normal maritime traffic and lower insurance costs in key global chokepoints would ease logistical bottlenecks. A benchmark’s value is tied to the deliverability of its underlying commodity; reduced shipping risk would help restore a more typical Brent-WTI price hierarchy.
Conclusion
So, why is WTI trading above Brent in 2026? The most precise answer is that the market was pricing a severe shortage of prompt, deliverable barrels, which created an unusually distorted front-end of the futures curve and fueled a global scramble for accessible U.S. crude. It was a story of pricing, spreads, and logistics first, and only distantly a story about benchmark status.
For traders, the takeaway is clear: do not interpret the headline inversion as a permanent dethroning of Brent. Instead, read it as a powerful signal that the market placed an extraordinary, but likely temporary, value on immediate U.S. barrels. By monitoring same-month spreads, prompt backwardation, and physical premiums, traders can identify when this anomaly is likely to correct itself.
Frequently Asked Questions (FAQ)
1. Are traders comparing the wrong contracts?
Often, yes. Front-month-to-front-month comparisons can exaggerate the inversion when prompt supply is under extreme stress due to differing contract expiration cycles. A more accurate analysis involves comparing contracts with the same delivery month to gauge the true price relationship for barrels delivered at the same time.
2. Is this a futures anomaly or a real shortage?
It is a reflection of a real, near-term physical shortage being expressed through the futures market. The explosion in physical spot premiums for U.S. crude, as documented in market reports, confirms that the tightness is not merely a paper-market phenomenon; refiners were actively paying record prices to secure immediate physical supply.
3. Why do spreads matter more than the headline price?
Spreads—the price difference between different contracts—reveal the underlying market structure. A steep backwardation spread (where prompt months are priced much higher than later months) is a much clearer indicator of immediate, acute scarcity than the flat price alone. It tells a story about the *time value* of a barrel, which is critical during a supply shock.
4. Does this mean Brent is no longer the global benchmark?
No. This event, on its own, does not dethrone Brent as the primary global benchmark, which prices the majority of the world’s seaborne crude oil. Instead, it highlights a temporary, acute demand for U.S.-based crude, positioning WTI as a critical ‘release valve’ for global supply disruptions and pricing its prompt barrels accordingly.