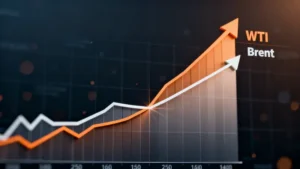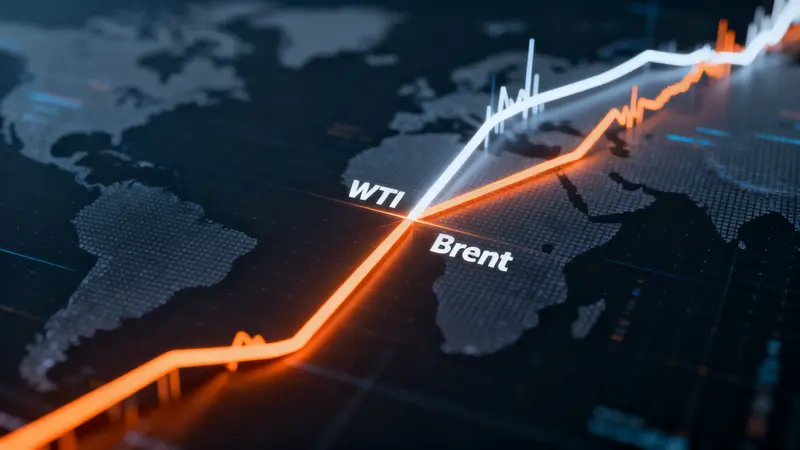
A screen showing West Texas Intermediate (WTI) crude trading above Brent is not enough on its own to prove a full-blown oil crisis. However, this rare market inversion becomes a much more serious warning when it appears alongside extreme backwardation, record physical premiums, and panic buying for immediate cargoes.
Understanding these layers is key to answering the critical question: is WTI above Brent a crisis signal? In early 2026, this very scenario played out, forcing traders to look beyond the headline price and into the physical market’s plumbing where the real story of supply and demand unfolds.
Table of Contents
WTI Above Brent Can Be a Warning, but Not for the Simplest Reason
An inversion in the world’s most-watched oil benchmarks is a significant event, but its meaning is often misinterpreted. The surface-level data can be misleading, yet ignoring the underlying stress drivers would be a critical trading error.
Why the Headline Alone Is Not Enough to Signal a Crisis
Observing the front-month WTI contract flip above its Brent counterpart can create an exaggerated sense of alarm due to technical factors. The two futures contracts often have different delivery windows and expiration dates. As noted by The Wall Street Journal during a similar event, an apparent premium can be shaped largely by contract structure and steep backwardation.
When you compare contracts with the same delivery month (e.g., June WTI vs. June Brent), the traditional Brent premium often remains intact. This discrepancy means a screen headline alone is insufficient to definitively conclude that WTI above Brent a crisis signal is flashing red.
Why the Market Still Should Not Ignore This Inversion
The signal becomes far harder to dismiss when the inversion coincides with acute scarcity for prompt barrels and record-breaking physical premiums. For instance, reports from Reuters in April 2026 highlighted that U.S. crude delivered to North Asia was offered at premiums of $30 to $40 per barrel above Brent- or Dubai-linked benchmarks.
Simultaneously, European bids for WTI Midland surged to around $15 above Brent. These are not trivial paper-market quirks; they represent real-world buyers paying substantial premiums for immediate physical supply, indicating a genuine supply squeeze that validates the stress shown in the futures market.
A Technical Comparison Error Can Make the Signal Look Bigger Than It Is
Before placing a trade based on a WTI-Brent inversion, it is crucial to understand the ‘false signal’ component that can trap unwary market participants. The structure of futures contracts plays a major role in the headline price.
How Front-Month Comparisons Exaggerate the Price Inversion
Front-month futures contracts are a proxy for urgency. When nearby supply is exceptionally scarce, the price of the nearest available barrel can detach from barrels for later delivery. This market structure is known as steep backwardation. In such an environment, WTI can appear stronger than Brent simply because its front-month contract reflects a more immediate delivery point experiencing a localized squeeze.
For example, on April 6, 2026, WTI settled at $111.54 while Brent settled at $109.27. This headline inversion drew significant attention, but it was partly because the front of the WTI curve was unusually distorted by short-term pressures.
Why Aligned-Month Comparisons Provide a Clearer Picture
A more rigorous test is to compare the same delivery month for both benchmarks or a more comparable point on each forward curve. This method strips out the noise from differing contract expirations. The EIA’s April 2026 outlook illustrated this perfectly; it showed the Brent-WTI spot spread averaging $12 in March and peaking at $15 in April.
This data implies that, on a spot basis, Brent remained structurally stronger and more expensive, even while front-month futures headlines briefly suggested otherwise. This distinction is vital for traders analyzing if the WTI above Brent a crisis signal reflects a fundamental regime shift or a temporary structural anomaly.
A Real Crisis Signal Appears When Physical Oil Tightens Too
The most important section for answering is WTI above Brent a crisis signal is this: the headline from the futures market must be confirmed by stress in the physical market. Without this confirmation, it remains a technical observation, not an actionable crisis indicator.
What Confirms the Signal Is Real: Record Premiums and Physical Demand
A genuine warning emerges when physical oil markets show extreme tightness concurrently with the futures headline inversion. During the April 2026 event, Reuters reported that Dated Brent reached $144.42 per barrel and Forties crude hit $146.09. Some physical cargoes were effectively pricing above $150 per barrel once freight and other costs were included.
Crucially, it was also reported that physical premiums for key European, African, and U.S. grades remained at record highs even after futures prices experienced a sharp pullback. This divergence shows that end-users, like refineries, were still scrambling for supply, confirming the crisis was real.
Why Physical Market Confirmation Matters More Than a Headline
The futures headline tells you what traders on a screen are speculating. The physical market tells you what refiners and trading houses are actually paying for usable barrels for immediate processing.
If physical premiums, freight costs, and immediate-delivery bids are all rising in unison, the question of is WTI above Brent a crisis signal becomes much easier to answer with a definitive ‘yes, it is a serious warning.’ The reporting from Reuters on April 6 and April 9, 2026, both pointed directly to this conclusion, highlighting a market under severe short-term duress.
| Signal Type | What It Tells a Trader | Reliability Level |
|---|---|---|
| Front-Month Inversion (WTI > Brent) | Indicates acute short-term stress, but can be distorted by contract timing. | Moderate |
| Aligned-Month Inversion | A cleaner, more structural signal that the WTI-Brent relationship is fundamentally changing. | High |
| Record Physical Premiums | Confirms that end-users are paying extraordinary prices for immediate physical supply. The most reliable indicator of a real shortage. | Very High |
Three Tests to Determine if the WTI-Brent Signal Is Serious
This framework provides a practical, systematic way for traders to evaluate the severity of a WTI above Brent a crisis signal. Running through these checks can prevent costly overreactions to headline noise.
Test 1: Is the Aligned-Month Spread Still Distorted?
First, look past the front-month contract. If a WTI contract for June delivery is still trading unusually tight to, or even above, the June Brent contract, the signal of stress is significantly stronger. If the inversion disappears once the delivery months are aligned, the headline was at least partially a calendar effect. Both The Wall Street Journal’s analysis and EIA reports support making this critical distinction.
Test 2: Is Backwardation Still at Extreme Levels?
Next, check the structure of the WTI curve itself. If the spread between the first month (M1) and second month (M2) contracts remains historically wide, it confirms the market is paying a significant premium for immediate delivery. Reuters noted that the spike in U.S. spot premiums in April 2026 directly followed a surge in the prompt monthly WTI spread. This is a classic footprint of a front-loaded supply squeeze, where the market is desperate for barrels *now*.
Test 3: Are Physical Premiums and Freight Costs Still Rising?
Finally, the ultimate confirmation comes from the physical world. If spot premiums for physical barrels, tanker charter rates, and bidding from refineries remain elevated or are still climbing, the price move is not just a screen illusion. Reports of intensified competition for U.S. barrels and freight pressures confirm that buyers are actively seeking alternatives to disrupted supply lines. When physical price strength outlasts a pullback in futures, the underlying stress is undeniable.
What the Current Market Data Says Right Now
The evidence from early 2026 supports a balanced but urgent interpretation. There are compelling arguments on both sides, which traders must weigh carefully.
The Case for “Yes, This Is a Serious Warning”
The bullish case for calling this a true crisis signal is strong. The headline data was stark: WTI settled at $111.54 on April 6 while Brent was at $109.27. More importantly, this was backed by undeniable physical market tightness. Reuters reported U.S. crude export premiums at record highs, offers for cargoes to North Asia at a staggering $30 to $40 above benchmarks, and physical crude prices effectively near or above $150 per barrel. These are classic signs of acute, short-term systemic stress.
The Case for “No, the Headline Alone Overstates It”
Simultaneously, the headline inversion clearly has a technical amplification effect. The EIA’s forecast, even amidst the turmoil, was for Brent to remain structurally above WTI on a spot basis and for the spread to narrow later in 2026 as global trade flows normalize. Therefore, a more nuanced conclusion is not that the global benchmark order has permanently flipped, but rather that the market is flashing a severe short-term stress warning, with the U.S. market at the epicenter of a global re-routing of crude oil barrels.
What Traders Should Do With This Signal
Translating this analysis into actionable strategy is the final step. Here is how professional traders approach such a complex signal.
- Do Not Trade the Headline in Isolation: A single WTI-Brent inversion is not enough to justify a major macro bet. Contract timing can distort the picture, and futures markets can overshoot fundamentals.
- Use It as a Stress Indicator, Not a Standalone Trigger: A better approach is to treat the inversion as one component of a broader market-stress dashboard. Read it in conjunction with same-month spreads, prompt backwardation, physical premiums, and downstream fuel prices.
- Watch for Confirmation in Products, Freight, and Inventories: The stress must show up elsewhere. The EIA forecasted U.S. retail gasoline to peak near $4.30 per gallon and diesel above $5.80. If these product prices and freight rates remain elevated even as futures ease, the signal of underlying tightness still has teeth.
What Would Tell You the Crisis Signal Is Fading
Just as important as identifying a crisis is knowing when it’s abating. Traders should monitor these key metrics for signs of normalization.
| De-escalation Indicator | Market Implication |
|---|---|
| Prompt Spreads Cool | If WTI M1-M2 backwardation narrows significantly, it signals that the immediate scarcity of barrels is easing. |
| Physical Premiums Retreat | When U.S., North Sea, and West African grades stop trading at record premiums to benchmarks, the physical supply squeeze is loosening. |
| Freight Normalizes | If tanker availability improves and freight costs cool, it means the logistical panic to secure nearby barrels is subsiding. |
| Risk Premium Fades | The EIA expects the Brent-WTI spread to decline from $15 in April to $9 in Q3 2026 and $4 by Q4 2026 as trade flows recover. A move toward this path indicates normalization. |
Conclusion
So, is WTI above Brent a crisis signal? The most accurate answer is: not by itself, but it becomes a powerful one when the physical market screams in agreement. A front-month futures inversion can be inflated by contract mechanics, but record spot premiums, near-$150 physical prices, and extreme prompt tightness transform that headline into a serious warning of a deeply stressed market. The combination of Reuters’ reporting on physical market records and the EIA’s outlook for eventual normalization supports this precise interpretation.
For traders, the professional move is not to chase the headline but to use it as a catalyst for deeper investigation. If aligned-month spreads remain distorted, backwardation stays extreme, and physical premiums continue to rise, the crisis signal is active and real. Conversely, if those underlying metrics begin to retreat, the warning is fading, even if headline crude prices remain elevated for a time.
Frequently Asked Questions (FAQ)
1. Is WTI trading above Brent always a crisis signal?
No. On its own, it can be a technical anomaly amplified by different contract delivery dates and front-month distortions. The signal becomes much more meaningful and qualifies as a crisis warning when confirmed by severe stress in the physical market, such as record premiums for actual barrels.
2. What are the most reliable signs that confirm the signal is real?
The clearest confirmations are found in the physical market. These include record-high spot premiums for U.S., European, and African crude grades; steep backwardation in the futures curve (indicating a rush for immediate supply); and persistent freight tightness with rising tanker costs. Reuters reported all three during the April 2026 squeeze.
3. How quickly can the WTI-Brent inversion signal fade?
The headline signal in the futures market can fade very quickly, sometimes within days or weeks, as speculative positions unwind or contract dynamics shift. However, the stress in the physical market often lags. As seen in 2026, physical crude prices can remain exceptionally strong even after futures prices have fallen back, indicating that the underlying supply shortage takes longer to resolve.
4. Is this signal more about paper contracts or real-world supply stress?
It is about both, but the more important component for identifying a true crisis is the real-world supply stress. The futures contract structure can magnify the headline and create initial noise. However, the physical premiums, which reflect what companies are paying for actual oil, tell you whether the shortage is genuine and severe. The latter is what ultimately dictates market direction.